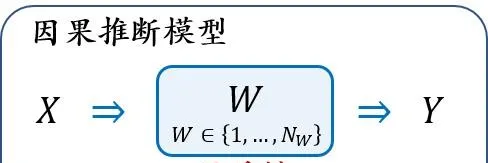
Definitions:
Unit : 研究个体, 在治疗手段效果研究中指每个病人样本.
Treatment/Intervention : 治疗/干预, 对每个研究对象施加的动作, 这里是治疗手段. W\in\{1,2,\dots,N_W\}
Potential Outcome : 对于每对 个体-治疗, 将治疗手段作用于病人后的可能输出. Y(W=w)
Observed Outcome
: 观测到的奖治疗手段实际作用于某病人后得到的输出.
Y^F=Y(W=w)
, w
为实际采用的某治疗手段.
Counterfactual Outcome : 反事实输出, 病人采用未实际使用的治疗手段得到的输出. Y^{CF}=Y(W=w')=Y(W=1-w)
Pre-treatment Variables : 不被治疗或干预影响到的变量, 比如病人的人口统计数据(demographics)、病历. X
Post-treatment Variables : 被治疗或干预影响到的变量, 比如病人的临床表现、医学检查结果.
Instrumental variables : 只影响治疗手段分配不影响输出的变量
Treatment Effects
用于衡量某种治疗手段或者干预是否起到效果.
Average Treatment Effect (ATE):
\textrm{ATE}=\mathbb{E}[Y(W=1) - Y(W=0)]
Average Treatment effect on the Treated group (ATT): \textrm{ATT}=\mathbb{E}[Y(W=1)|W=1] - \mathbb{E}[Y(W=0)|W=1]
Conditional Average Treatment Effect (CATE):
\textrm{ATT}=\mathbb{E}[Y(W=1)|X=x] - \mathbb{E}[Y(W=0)|X=x]
Individual Treatment Effect (ITE):
\textrm{ATE}=Y_i(W=1) - Y_i(W=0)
Goal: 根据观测到的数据 {X_i,W_i,Y_i^F}_{i=1}^N 去估计上述的treatment effects.

可以看到由于互斥性, 我们无法同时观测到不同治疗手段作用于同一个样本上的效果, 同时,在实际生活中W 是 非随机分配 (不能按照随机对照试验来对比), 这样就导致直接估算会因受到selection bias的影响而产生不准确的效果估计.
为实现估计每种治疗手段效果的目标, 我们需要解决两个问题:
(1) 如何利用观测到的 emperical outcome 去估计 potential outcome?
(2) 如何处理 treatment effect estimate 过程中涉及到的 counterfactual outcome?
Assumptions:
Assumption 1. Stable Unit Treatment Value Assumption (SUTVA): The potential outcomes for any unit do not vary with the treatment assigned to other units, and, for each unit, there are no different forms or versions of each treatment level, which lead to different potential outcomes. 不同病人之间、某病人不同治疗手段之间不存在依赖.
Assumption 2. Ignorability: Given the background variable, X , treatment assignment W is independent to the potential outcomes, i.e., W\perp\kern-5pt\perp Y(W=0), Y(W=1)|X
Assumption 3. Positivity: For any value of X , treatment assignment is not deterministic: P(W=w|X=x)>0, ~~\forall~w~\textrm{and}~x. 每种治疗方式都会被分配到.
基于 Assumption 1 & 2, 我们可以解决第一个问题, 建立对 potential outcome 的 unbiased emperical estimator: \begin{split} \mathbb{E}[Y(W=w)|X=x] &= \mathbb{E}[Y(W=w)|W=w,X=x]~~(\textrm{Ignorability}) \\ &= \mathbb{E}[Y^F|W=w,X=x] \end{split}
对于第二个问题可以使用 kernel-based method 来解决 (Counterfactual Mean Embeddings)
Confounders
Confounders : 混杂因素, 那些既影响treatment又影响outcome的变量.
Selection bias : 观测到的group和感兴趣的group不一致 p(X_{obs})\neq p(X_\ast) .

在这个样本中confounder为年龄, 所以忽略年龄直接看整体的治疗效果是treatment A好于treatment B, 但B在每个young和old的两个groups中的表现均优于A. 在这种情况下忽略confounder引起来的两种治疗手段在测试所选择的分组年龄分布上的差异 (selection bias), 就会得到错误的治疗效果评估.
selection bias <=> covariate shift \quad p(X_{obs})\neq p(X_\ast)Adjust confounders
先估计对confounder的条件概率分布, 然后对根据confounder的分布进行概率平均.
\begin{split} \hat{\textrm{ATE}} &= \sum_x p(x)\mathbb{E}[Y^F|X=x,W=1] - \sum_x p(x)\mathbb{E}[Y^F|X=x,W=0] \\ &= \sum_{\mathcal{X}^\ast} p(X\in\mathcal{X}^\ast) \left(\frac{1}{N_{\{i:X_i\in\mathcal{X}^\ast,W_i=1\}}} \sum_{\{i:X_i\in\mathcal{X}^\ast, W_i=1\}} Y_i^F \right) \\ &\quad - \sum_{\mathcal{X}^\ast} p(X\in\mathcal{X}^\ast) \left(\frac{1}{N_{\{j:X_j\in\mathcal{X}^\ast,W_j=1\}}} \sum_{\{j:X_j\in\mathcal{X}^\ast, W_j=0\}} Y_j^F \right) \end{split}
where \mathcal{X}^\ast is a set of X values, p(X\in\mathcal{X}^\ast) is the probability of the background variables in \mathcal{X}^\ast over the whole population, {i:x_i\in\mathcal{X}^\ast,W_i=w} is the subgroup of units whose background variable values belong to \mathcal{X}^\ast and treatment is equal to x .
Causal Inference Methods relying on Three Assumptions
Re-weighting Methods

Propensity Score: e(x)=Pr(W=1|X=x)
Propensity Score Based Sample Re-weighting
1. Inverse propensity weighting (IPW) : 对每个样本施加一个权重 r : r=\frac{W}{e(x)}-\frac{1-W}{1-e(x)}
IPW estimator:
\hat{\textrm{ATE}}_{IPW} = \frac{1}{n}\sum_{i=1}^n\frac{W_iY_i^F}{\hat{e}(x_i)} - \frac{1}{n}\sum_{i=1}^n \frac{(1-W_i)Y_i^F}{1-\hat{e}(x_i)}.
在实际使用时, 常使用其正则化的版本:
\hat{\textrm{ATE}}_{IPW} = \frac{1}{n}\sum_{i=1}^n\frac{W_iY_i^F}{\hat{e}(x_i)}/\frac{1}{n}\sum_{i=1}^n\frac{W_i}{\hat{e}(x_i)} - \frac{1}{n}\sum_{i=1}^n\frac{(1-W_i)Y_i^F}{1-\hat{e}(x_i)} / \frac{1}{n}\sum_{i=1}^n \frac{(1-W_i)}{1-\hat{e}(x_i)}.
2. Doubly Robust (DR) estimator / Augmented IPW:
通过将 propensity score 与 outcome regression 结合来解决对propensity score的估计不准确时较大的ATE估计误差. \begin{split} \hat{\textrm{ATE}}_{DR} &= \frac{1}{n}\sum_{i=1}^n\left\{\left[\frac{W_iY_i^F}{\hat{e}(x_i)} - \frac{W_i-\hat{e}(x_i)}{\hat{e}(x_i)}\hat{m}(1,x_i)\right] - \left[\frac{(1-W_i)Y_i^F}{1-\hat{e}(x_i)} - \frac{W_i-\hat{e}(x_i)}{1-\hat{e}(x_i)}\hat{m}(0,x_i) \right]\right\} \\ &= \frac{1}{n}\sum_{i=1}^n\left\{\hat{m}(1,x_i) + \frac{W_i(Y_i^F-\hat{m}(1,x_i))}{\hat{e}(x_i)} - \hat{m}(0,x_i)\frac{(1-W_i)(Y_i^F-\hat{m}(0,x_i))}{1-\hat{e}(x_i)} \right\} \\ \end{split} 这里的 \hat{m}(1,x_i) 和 \hat{m}(0,x_i) 分别是对治疗组和对照组的回归模型估计.
3. covariate balancing propensity score (CBPS):
直接提升对propensity score的估计
\mathbb{E}\left[\frac{W_i\tilde{x}_i}{e(x_i;\beta)} - \frac{(1-W_i)\tilde{x}_i}{1-e(x_i;\beta)}\right]=0
where \tilde{x}_i is a predefined vector-valued measurable function of x_i .
Confounder Balancing
Data-Driven Variable Decomposition ( \textrm{D}^2\textrm{VD} ) :
all observed variables = adjustment variables (可由outcome预测的变量) || confounders || irrelevant variables.
Adjusted outcome:
Y^\ast_{\mathrm{D^2VD}} = \left(Y^F-\phi(\mathbf{z})\right) \frac{W-p(x)}{p(x)(1-p(x))}
\mathbf{z} 对应于 adjustment variables.
ATE estimator for \textrm{D}^2\textrm{VD} :
\textrm{ATE}_{\mathrm{D^2VD}} = \mathbb{E}\left[\left(Y^F-\phi(\mathbf{z})\right)\frac{W-p(x)}{p(x)-(1-p(x))}\right]
\begin{split} \textrm{minimize}&~||(Y^F-X\alpha)\odot R(\beta)-X\gamma||^2_2,\\ &\textrm{s.t.}\quad \sum_{i=1}^N \log(1+\exp(1-2W_i)\cdot X_i\beta) < \tau,\\ &||\alpha||_1\leq\lambda,~||\beta||_1\leq\delta,~||\gamma||_1\leq\eta,~||\alpha\odot\beta||_2^2=0 \end{split}
这里 \alpha 分离出 adjustment variables, \beta 分离出 confounders, \gamma 消除 irrelevant variables.
Stratification Methods
将treated group和control group划分为同质的子群, 这样他们在每个子群内可被看作随机对照试验. 这样对每个子群估算CATE后,可通过聚合操作得到整体的ATE.
分治的思想, 整体使用统一的measure无法当作随机试验, 划分子群后采用不同的measure可看作随机试验.
\textrm{ATE}_{\textrm{start}} = \hat\tau^{\textrm{start}} = \sum_{j=1}^J q(j) \left[\bar{Y}_t(j) - \bar{Y}_c(j)\right]
where q(j)=\frac{N(j)}{N} .
划分子群的方式主要是 equal frequency approach, 将出现频率相同的归为同一组.
Matching Methods
在观测到的group里找相近的样本来近似对counterfactual的估计.
\hat{Y}_i(0) = \left\{ \begin{array}{rcl} & Y_i & \textrm{if} & W_i=0, \\ & \frac{1}{\#\mathcal{J}(i)}\sum_{l\in\mathcal{J}(i)}Y_l & \textrm{if} & W_i=1; \end{array}\right. and \hat{Y}_i(1) = \left\{ \begin{array}{rcl} & \frac{1}{\#\mathcal{J}(i)}\sum_{l\in\mathcal{J}(i)}Y_l & \textrm{if} & W_i=0; \\ & Y_i & \textrm{if} & W_i=1; \end{array}\right.
where \mathcal{J}(i) is the matched neighbors of unit i in the opposite treatment group.

1. Distance Metric:
D(\mathbf{x}i, \mathbf{x}_j)=|e_i-e_j|
D(\mathbf{x}_i, \mathbf{x}_j)=|\textrm{logit}(e_i)-\textrm{logit}(e_j)|\quad recommended
D(\mathbf{x}_i, \mathbf{x}_j)=||\hat{Y}_c|\mathbf{x}_i - \hat{Y}_c|\mathbf{x}_j||_2 prognosis score: calculate the difference in estimated control outcome
HSIC-NNM M_w=\textrm{argmax}_{M_w}\textrm{HSIC}(\mathbf{X}_wM_w,Y_w^F)-\mathcal{R}(M_w) : 基于learned mapping space
2. Matching Algorithm:
(1) Nearest Neighbor Matching; (2) Caliper and radius; (3) Stratification and Interval; (4) Kernel and Local Linear. Coarsened Exact Matching (CEM)
因为可以直接拿到匹配到的样本, 所以基于matching的算法解释性很好
3. Feature Selection:
Tree-based Methods
classification trees & regression trees
classification And Regression Tree (CART), Bayesian Additive Regression Trees (BART)
使用树的优点是,它们的叶子可以沿着信号快速变化的方向变窄,沿着其他方向变宽. 而当特征空间的维度相当大时,可能会导致功率的大幅增加.
Representation Learning Methods
1. Domain Adaptation Based on Representation Learning
核心思想是把观测到的group作为training domain (有data和label), 未观测到的group作为test domain (仅有data), 这样就构成了UDA的问题.
给定特征提取器 \Phi:X\rightarrow R 以及 分类器 h:X\times{0,1}\rightarrow Y , Integral probability metric (IPM) based objective function:
\min_{h,\Phi}\frac{1}{n}\sum_{i=1}^nr_i\cdot \mathcal{L}\left(h(\Phi(x_i),W_i), y_i\right) + \lambda\cdot R(h) + \alpha\cdot \textrm{IPM}_G\left(\{\Phi(x_i)\}_{i:W_i=0},\{\Phi(x_i)\}_{i:W_i=1}\right)
这里 r_i=\frac{W_i}{2u}-\frac{1-W_i}{2(1-u)} 修正group size的mismatch, u=\frac{1}{n}\sum_{i=1}^nW_i , R 表示模型复杂度.
实现IPM距离可以采用Wasserstein distance或者MMD.
2. Matching Based on Representation Learning
主要解决matching时受到样本不相关variables影响而引导到错误的匹配上.
(1) 学习映射矩阵 (2) deep feature selection与representation learning结合
3. Continual Learning Based on Representation Learning
(1) 利用 feature representation distillation 保留学到的知识
Multi-task Learning Methods
核心思想用三个branch来处理: shared branch, treated group specific branch 以及 control group specific branch. selection bias可通过 propensity-dropout regularization scheme 来消除.
Beyesian method 消除对 counterfactual outcomes的不确定性
Meta-Learning Methods
 Loop:
 Step 1: Estimate the conditional mean outcome E[Y|X=x]
 Step 2: Derive the CATE estimator based on the difference of results
Methods Relaxting Three Assumptions
1. Relaxing Stable Unit Treatment Value Assumption
2. Relaxing Unconfoundedness Assumption
observed and unobserved confounders
但是使用部分confounder一样可以得到精确的treatment effect estimator
3. Relaxing Positivity Assumption
Reference
[1] Liuyi Yao, Zhixuan Chu, Sheng Li, Yaliang Li, Jing Gao, Aidong Zhang. A Survey on Causal Inference. ACM Transactions on Knowledge Discovery from Data, 2021. [URL]


